
Witch magic symbols. Doodle esoteric, boho mystical

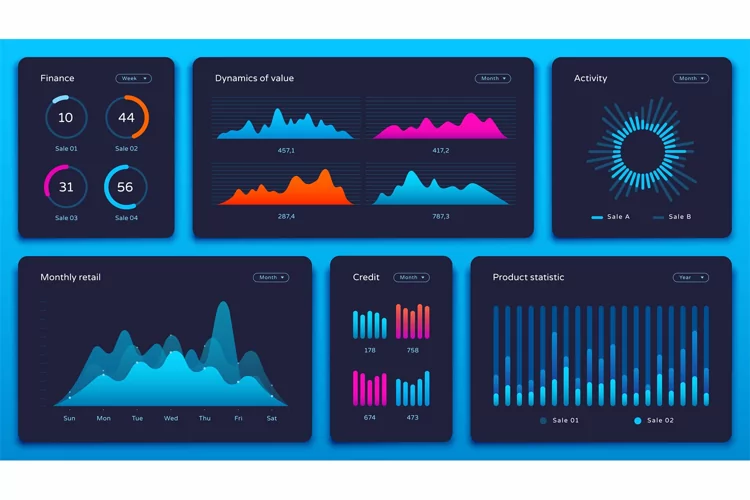
Infographics charts. Business diagrams, graphs and flowchart for workflow progress process. Finance annual report vector elements. Illustration flowchart and diagram, graph business workflow
Files included: EPS, JPG