
Witch magic symbols. Doodle esoteric, boho mystical

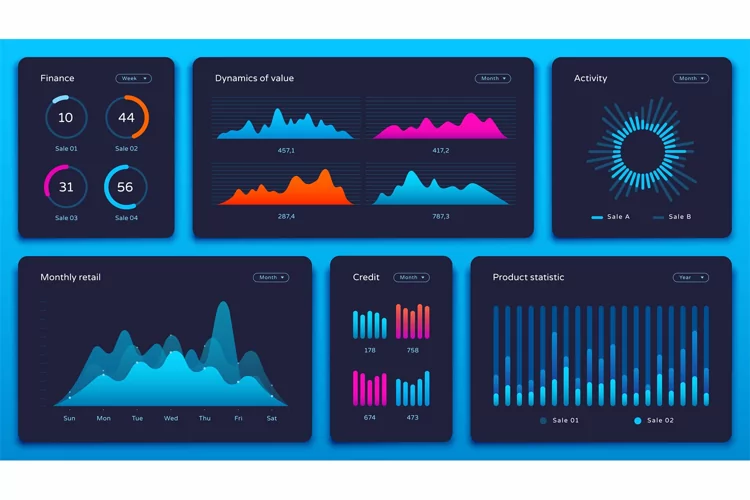
Infographic charts. Colorful data graphs, statistics dashboard chart and analytic presentation graph vector set. Business data visualization, stock market diagram on black background. Sales analysis
If you want to separate elements or edit something, please use vector editor e.g. Illustrator
Files included: EPS, JPG