How to Create Charts in Canva
Learn how to create various types of charts in Canva with this step by step beginner tutorial.
Charts and graphs are important visual representations. They help your audience understand data quickly when a simple table is not enough. This is often used in comparing sales figures, and in demonstrating trends and patterns. In this tutorial, we’re going to show you how to create charts in Canva. With Canva’s drag-and-drop interface, creating charts and graphs has never been easier.
Select Design Layout and Data
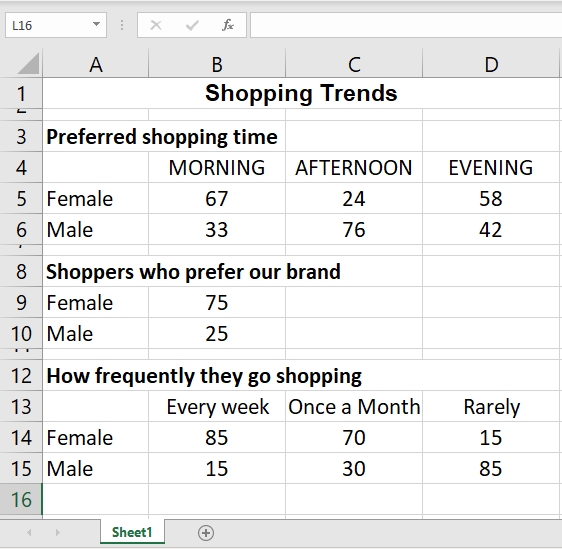
We want to create a visual representation of data about shopping trends. To do this, we will be using Canva's chart infographic feature with the data below. The infographic will be created with three types of charts- Line chart, Pie chart, and Bar chart.
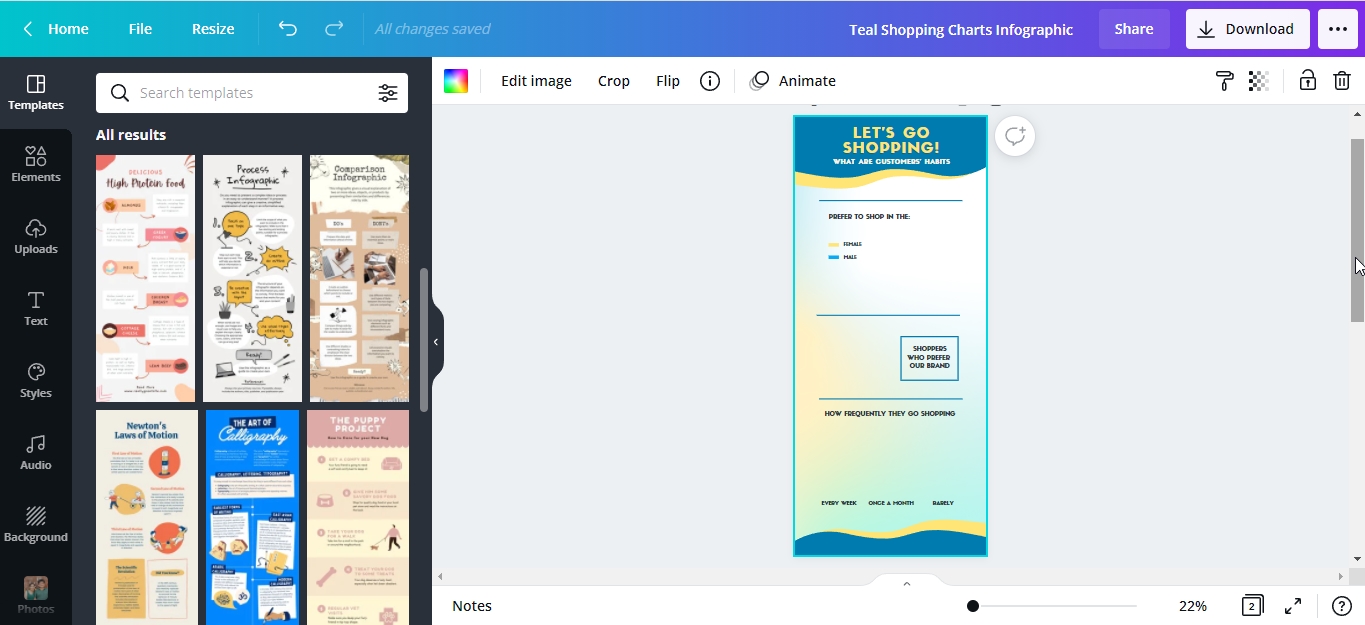
Open your existing design where you want your charts added.We already created the design layout of our infographic. We will just add the charts.
Line Chart
Line charts simply use a line to connect several data points that you plot.
Step 1- Choose a Line Chart
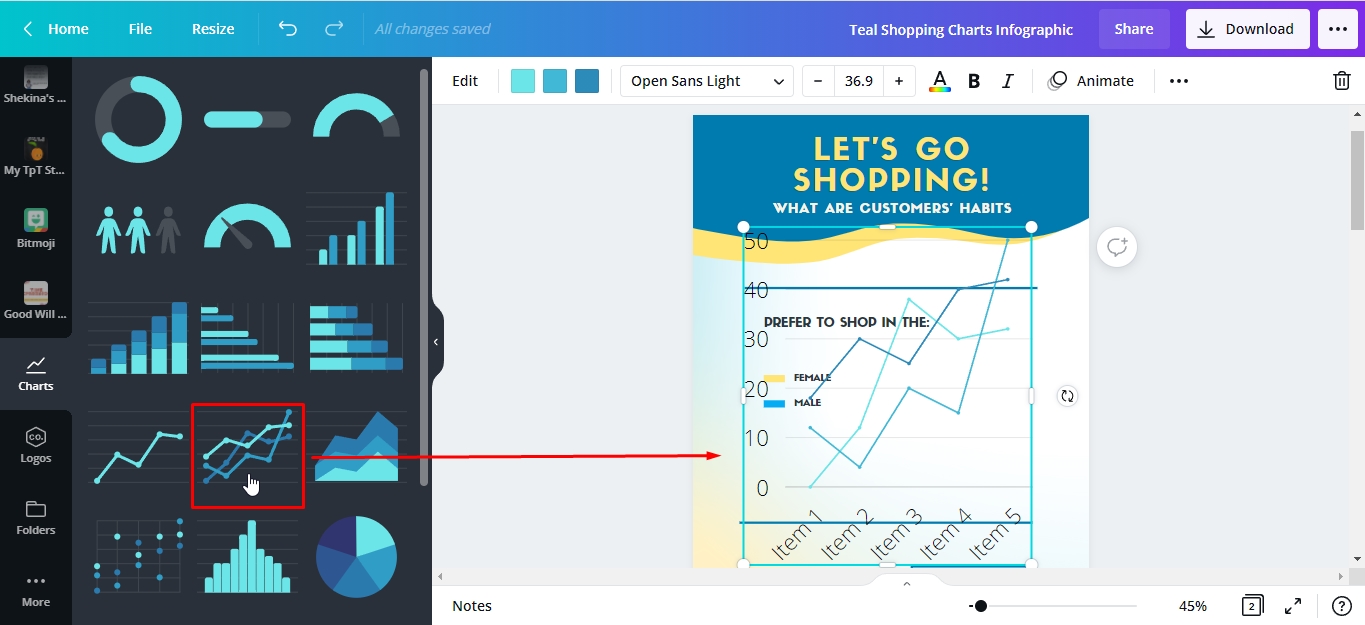
Search for the chart tab from the editor side panel. If you can't see your chart on the left panel, it's under the 3 dots that say More.
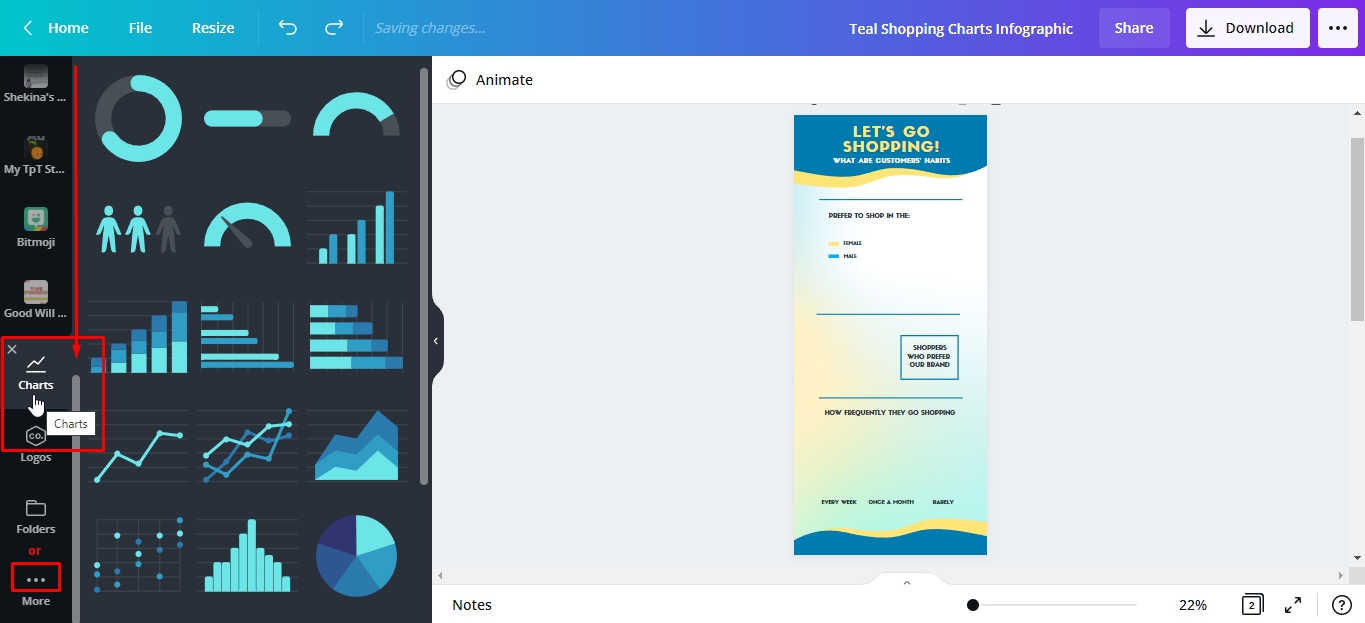
Select the type of chart you want to use. We clicked the second style of line chart. It will be added to your design space.
Step 2 - Edit Line Chart Data
The sidebar will automatically display the data fields in a table that you can edit.
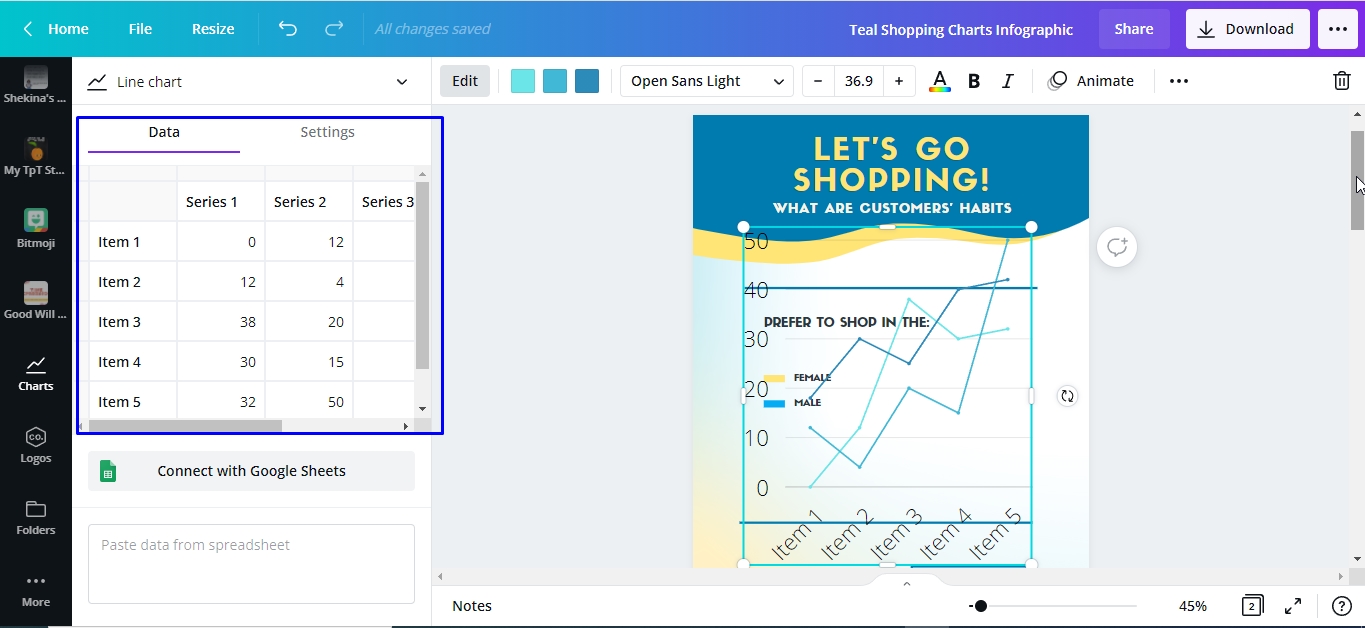
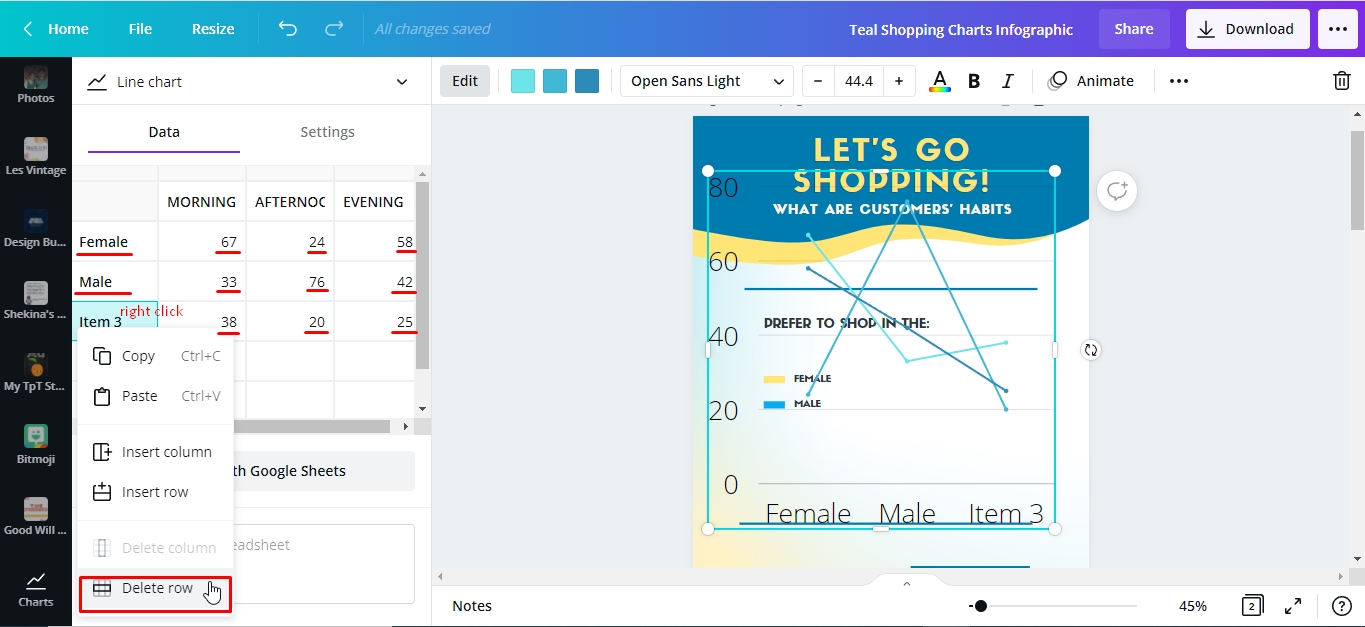
Click the fields in the table to input your data. To remove extra rows and columns, right-click on the cell > delete row/column. To add more, right-click on the cell > insert row/column.
To change the settings, click on settings > toggle the buttons and click on the plot series that you prefer. We want our line chart to show the labels, grid lines, and ticks so we left the settings as is. We changed the plot series from the default plot columns to plot rows.

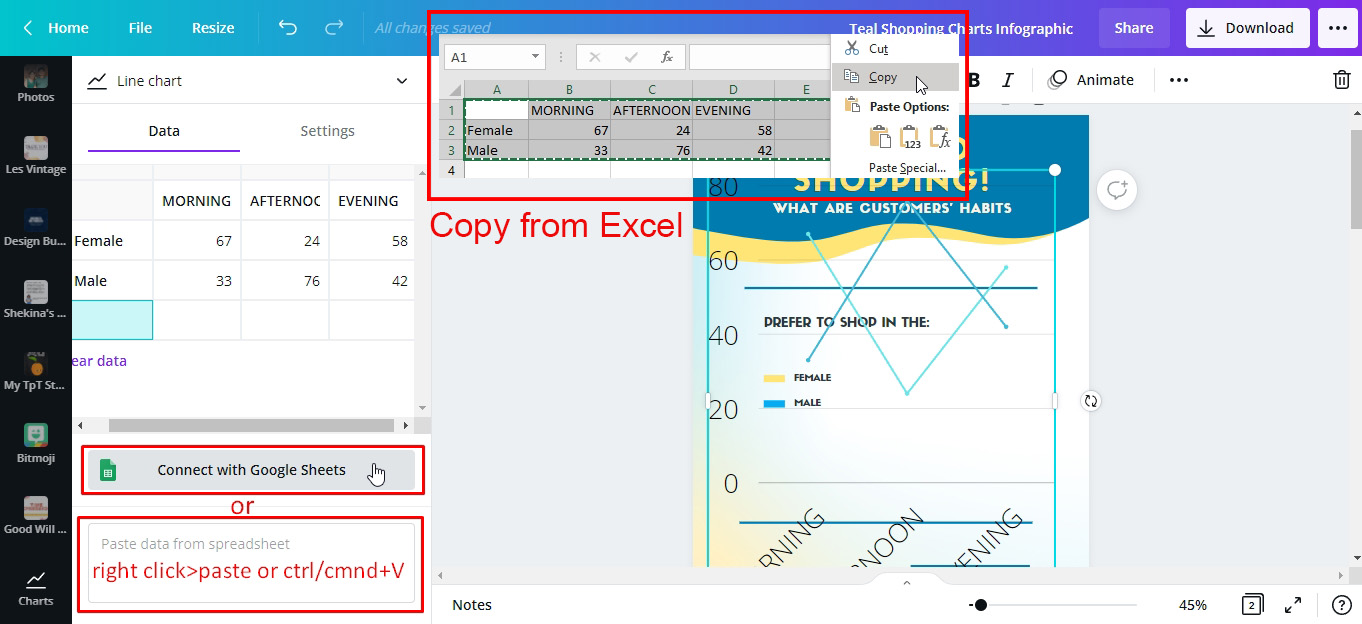
Alternatively, if you don’t want to input your data manually, you can copy the data from a separate spreadsheet. Do this either by connecting to Google Sheets or by copying your data directly from a spreadsheet. Then paste into the text field at the bottom of the side panel to quickly fill in the data table.
Here, we copied our data from an Excel spreadsheet and pasted into the text field.
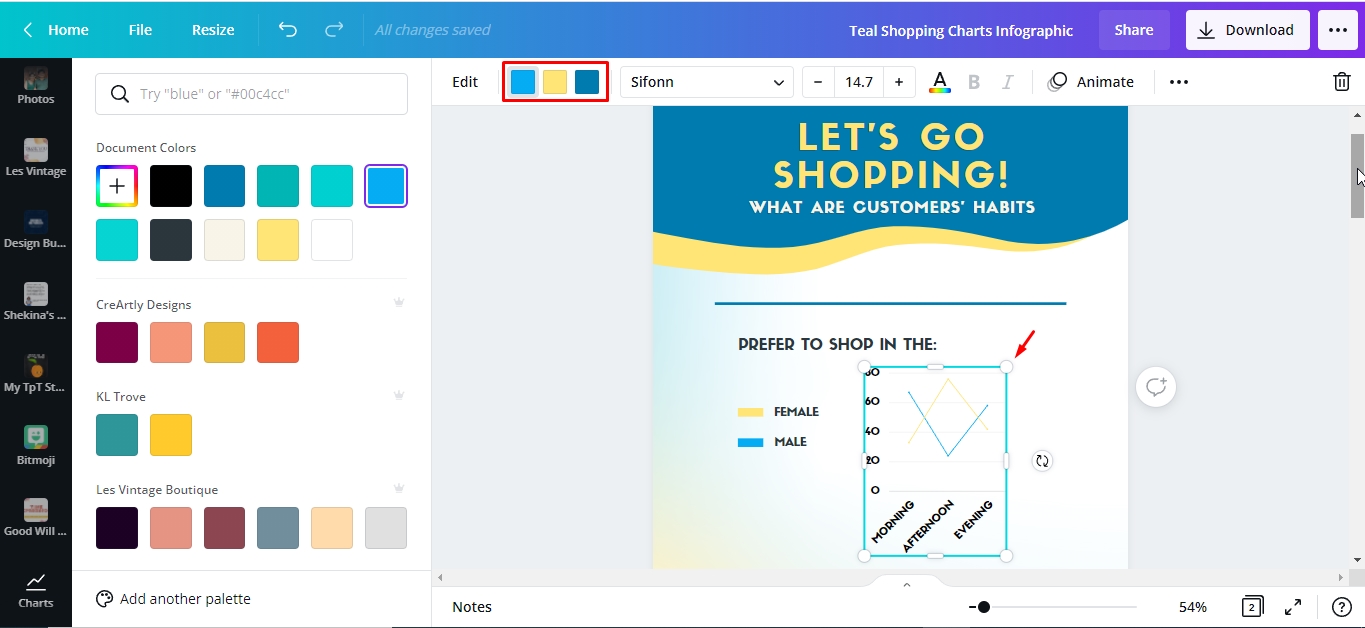
Step 3 - Edit Chart Colors and Size
To edit the Chart color, select the chart then click a color tile on the toolbar above the editor. Next, select your desired color to change the chart's color scheme.
Scale the chart down by dragging the corners in and position it appropriately.
Pie Chart
A pie chart compares parts to a whole where each pie section is a particular category within the whole.
Go back to the chart tab from the editor panel. We will follow the same process above.
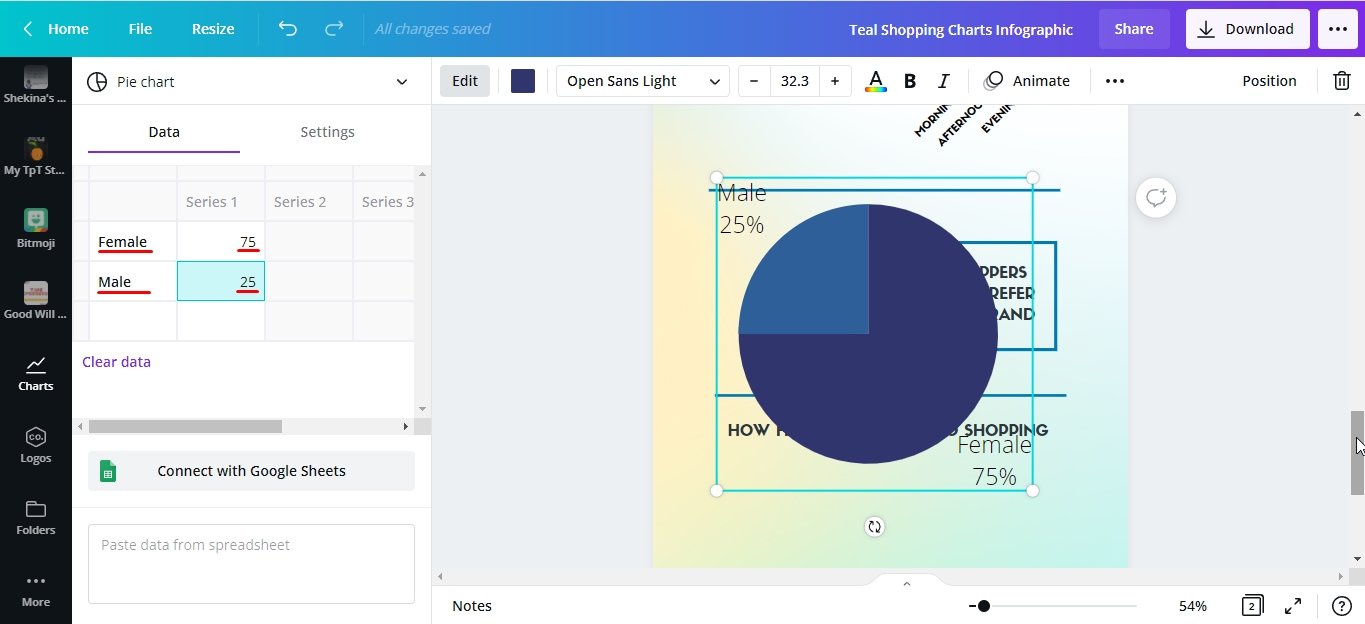
Step 1- Select your Pie Chart
We clicked the pie chart this time. This was then added to our layout as seen in the image below.

Step 2 - Edit the Pie Chart Data
Following the same process as before, edit the data fields displayed in the sidebar.
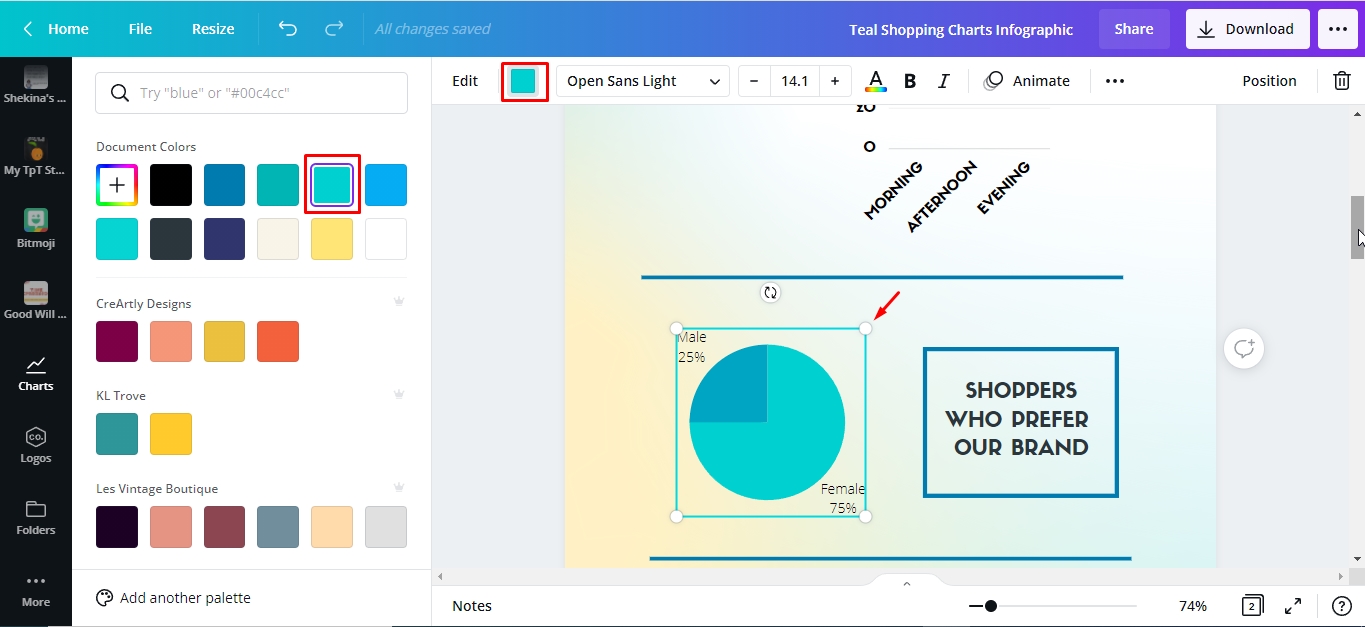
We changed the chart color to sky blue then scaled the chart down. We also positioned it appropriately.
Bar Chart
This time, we will create a bar chart. In a bar chart, the height of the bar represents the measured value: the higher the bar, the greater the value.
Step 1- Select the Type of Bar Chart
We selected this stacked bar chart, which was added to our layout.

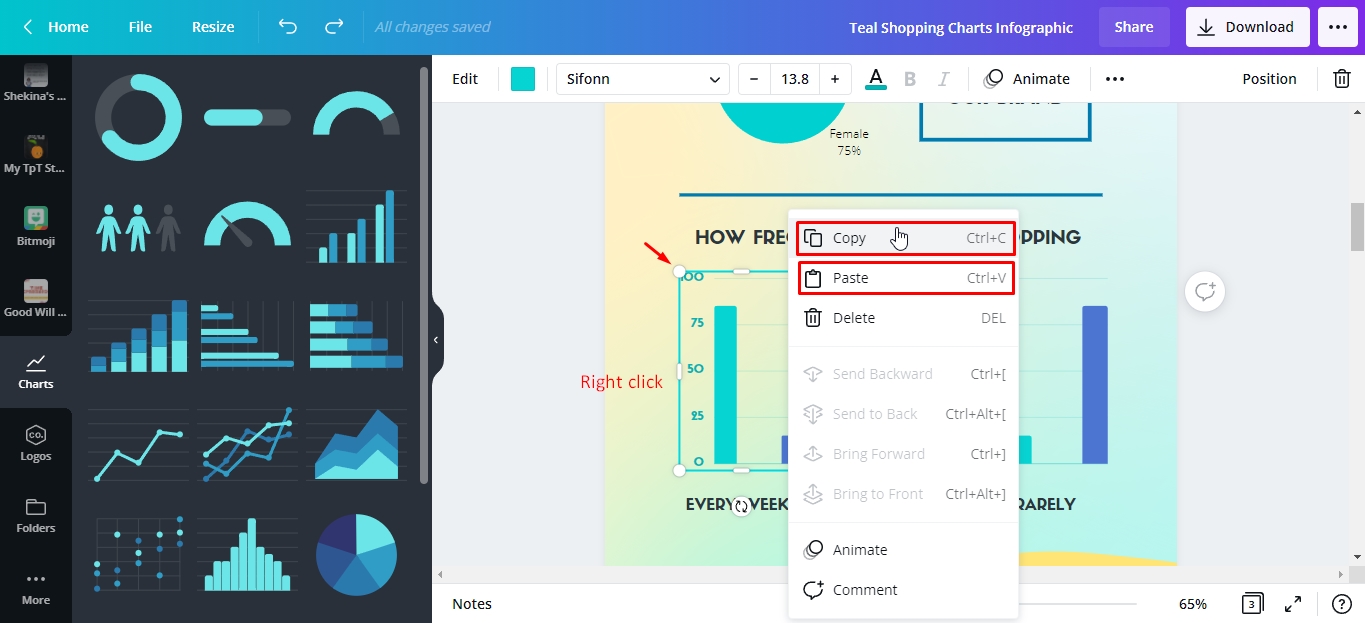
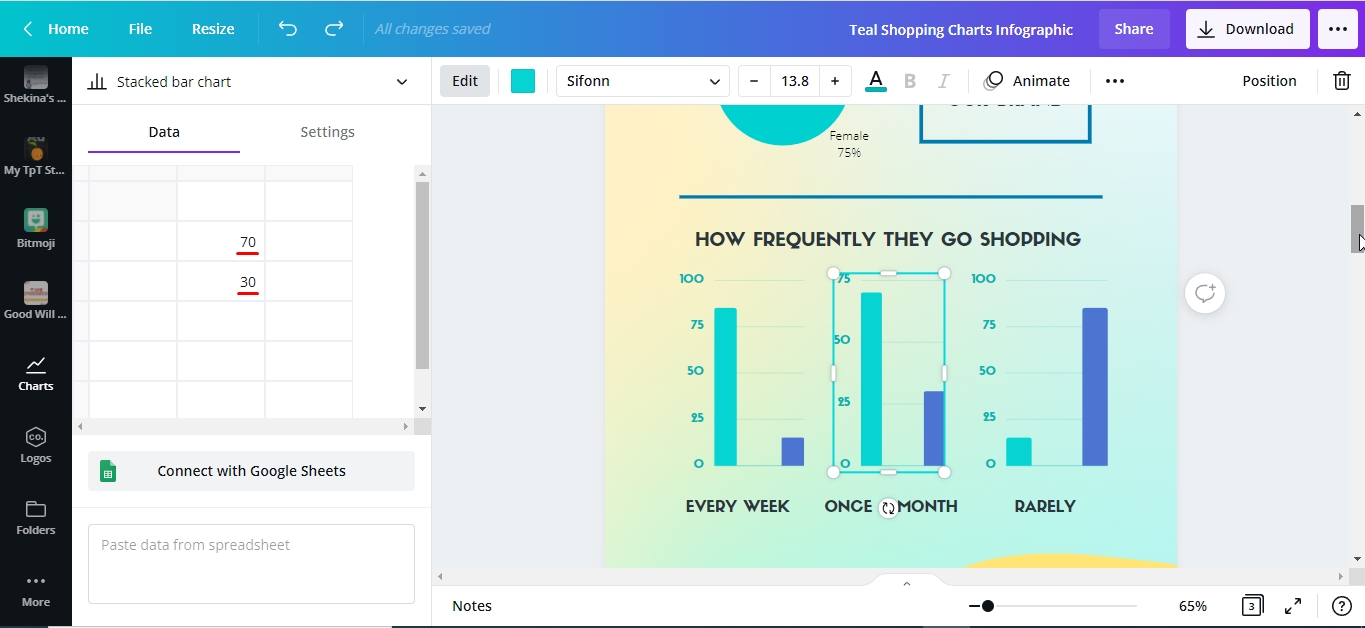
Step 2- Edit then copy Chart Data
In this step we want to create three copies of this chart. First, edit the data fields in the table.

Scale down the size of the bar chart then make another two copies. Select/highlight it > right-click > copy or press Ctrl/⌘ + C > paste or press Ctrl/⌘ + V.
In the same way as the first bar chart, edit the data for the remaining charts.
Our infographic design is now finished. You can compare the three different chart types in the following image.
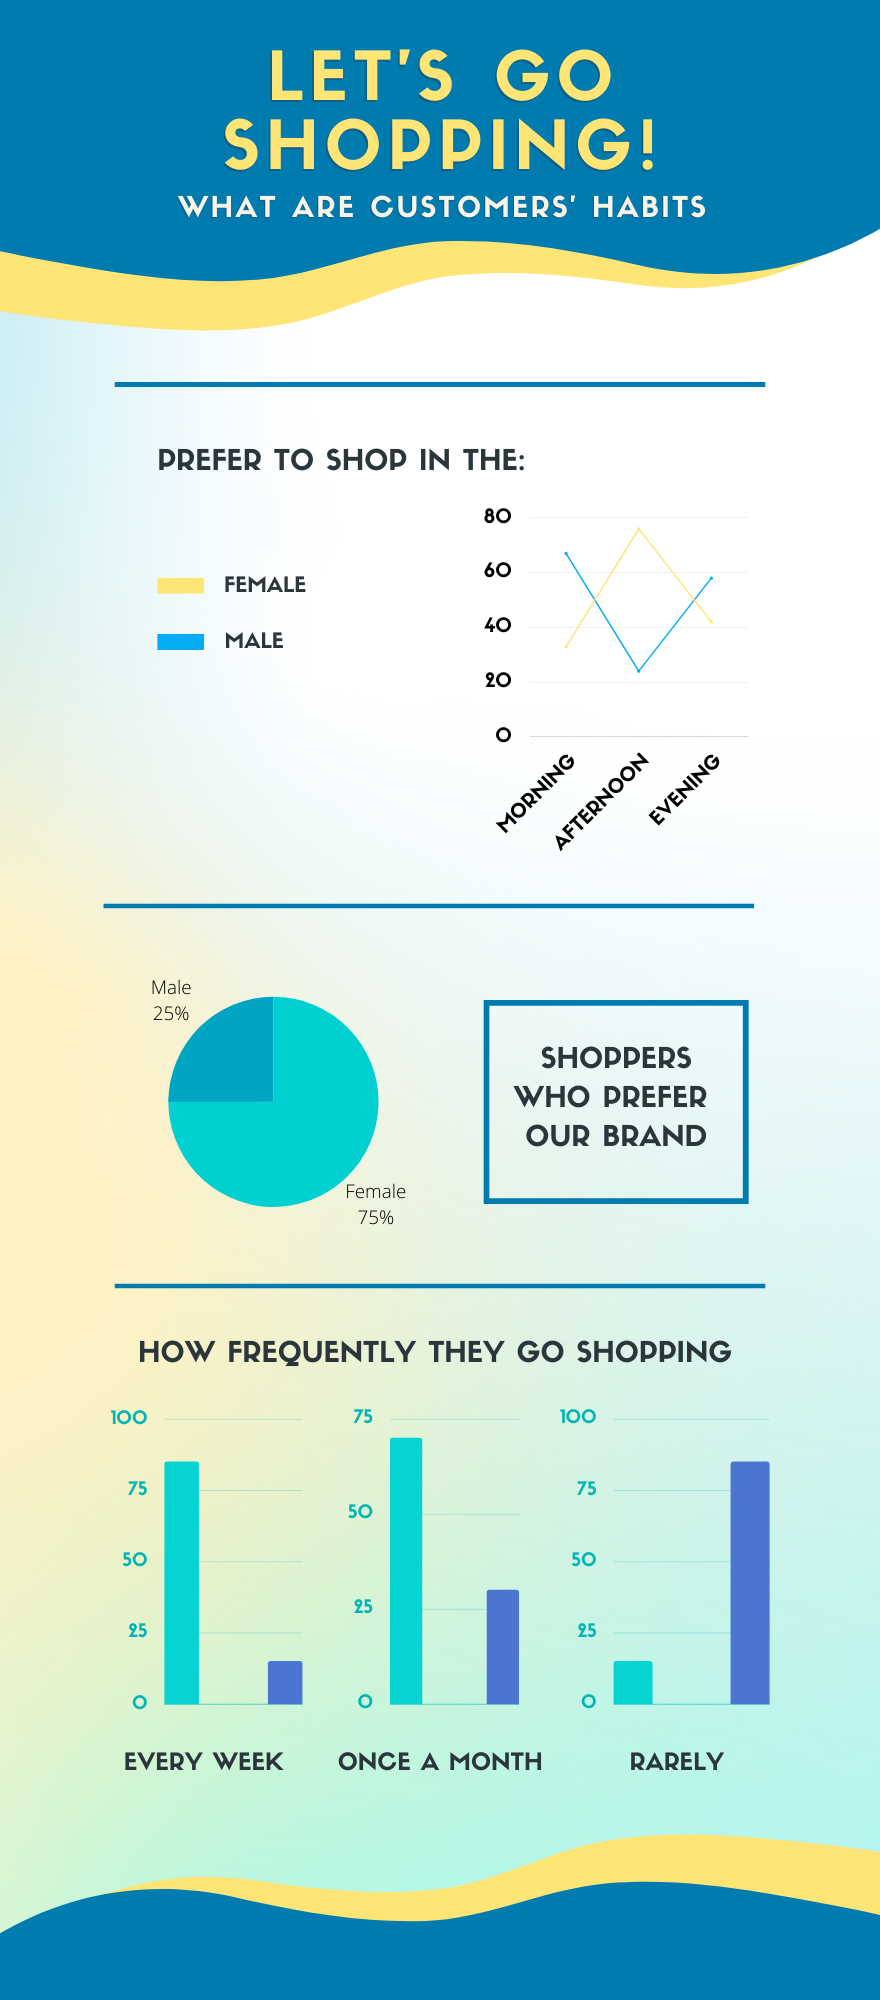
In just a few clicks, Canva has provided us with graphing and data visualization.Now you can share your infographic to your social media platforms or embed it on your website.
Be sure to check out our other tutorials on how to group in Canva, how to use Canva templates on iOS, and how to remove the background of a photo in Canva.